Autopilot ESP Failure: Tracing the Error from Screen to Root Cause
Table of Contents
When the Enrollment Status Page Fails
This article picks up where the previous article left off. If you followed that walkthrough, you have a working Autopilot deployment that registers devices, joins them to Entra ID and delivers apps through the Enrollment Status Page. This part covers what to do when that process breaks.
The Enrollment Status Page is the gatekeeper of Windows Autopilot. It tracks device preparation, device setup and account setup in sequence, holding the user at a progress screen until every assigned policy and application has been applied. When everything works, the user sees green checkmarks, login and lands on a configured desktop but when something fails, the ESP displays an error code and stops.
The error code alone rarely tells you enough, so for example an error code like 0x80070001 can mean a bad install command, a missing file, a permissions issue or a detection rule mismatch. The real troubleshooting starts after the error screen, inside the logs, registry and event viewer entries that Windows records at every stage of the process.
To demonstrate a complete investigation, I’ve set up a controlled failure with a real Autopilot deployment with three Win32 apps where one is deliberately configured to fail. This article walks you through every step I took to trace that failure from the ESP error screen to the root cause, using only PowerShell and built-in Windows tools. No third-party software, no scripts to download, nothing that isn’t already on the device during OOBE.
The crime scene
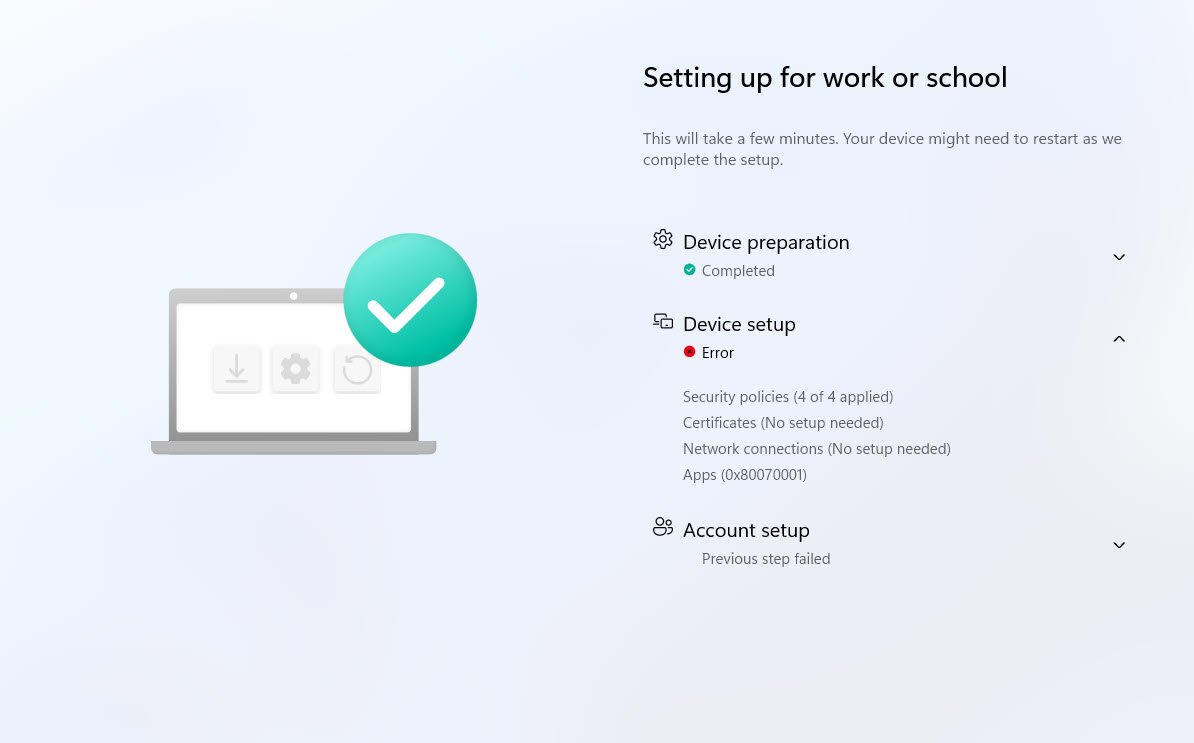
The Enrollment Status Page (ESP) has failed, device preparation completed successfully but Device Setup shows an error. The Apps category reports error code 0x80070001 and Account setup was never reached, displaying “Previous step failed.”
Now your mission, should you choose to accept it, is to trace the failure from the ESP screen all the way down to the root cause using only PowerShell commands and built-in Windows capabilities.
The troubleshooting method demonstrated here relies exclusively on native Microsoft tools, avoiding third-party utilities, community scripts or external frameworks. This approach is particularly valuable for administrators operating in security restricted environments or for those who need a fast and reliable diagnostic path without introducing additional tooling into the provisioning workflow.
STEP 1: Open Autopilot Diagnostics (Ctrl+Shift+D)
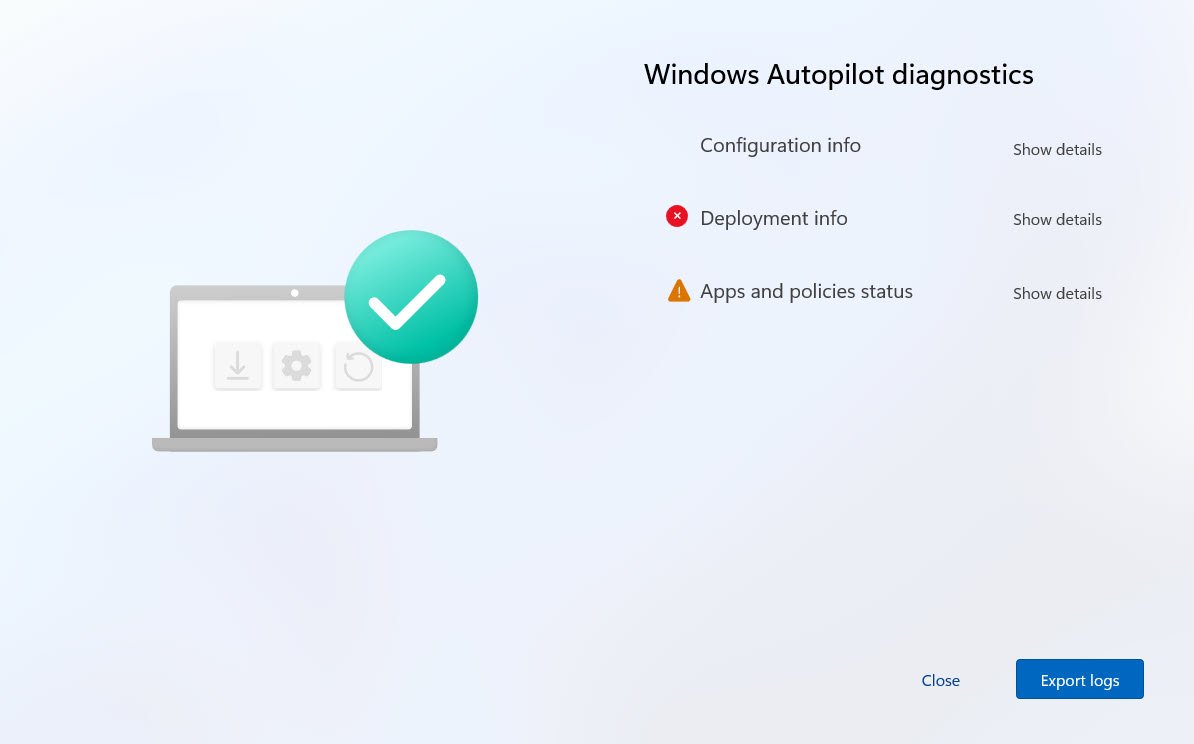
Before touching any logs (Export logs) just press Ctrl+Shift+D on the failed ESP screen which opens the built-in Windows Autopilot diagnostics page, showing Configuration info, Deployment info and Apps and policies status:
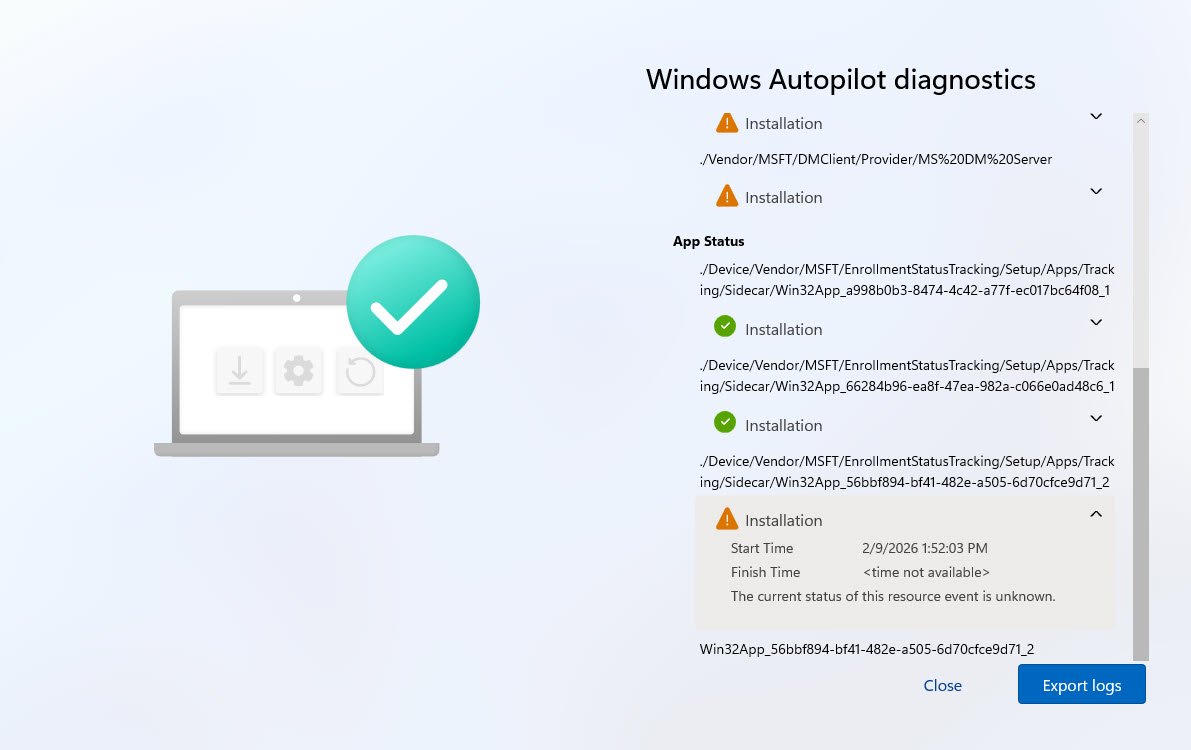
Under “Apps and policies status” -> “App Status”, three Win32 apps are tracked by Sidecar.
What is Sidecar? Sidecar is the internal codename for the Intune Management Extension (IME) the agent that handles Win32 app installations on Intune-managed devices. During the Enrollment Status Page, Sidecar is the provider that tracks Win32 app installations and reports their status back to ESP and it tracks only Win32 apps but no PowerShell scripts. The registry path …\Sidecar\Win32App_{AppID} is where each app’s installation state is recorded, with values ranging from 1 (In Progress) through 3 (Success) to 4 (Failed). When any app hits state 4, ESP stops and reports the error.
Two show green checkmarks (Installation successful), the third “Win32App_56bbf894-bf41-482e-a505-6d70cfce9d71_2” shows a warning triangle with the following information:
Start Time: 2/9/2026 1:52:03 PM Finish Time: < time not available > Status: The current status of this resource event is unknown.
💡Clue #1 The app started but never finished “Finish Time: < time not available >” means the install process exited without reporting completion back to the ESP tracker.
STEP 2: Open Command Prompt and PowerShell
Press Shift+F10 to open a Command Prompt during OOBE and launch PowerShell by typing “PowerShell” following the command:
Note: The Sidecar registry doesn’t just record pass/fail but it takes periodic snapshots showing the progression of every tracked app over time. This is the first thing to check because it tells you immediately which app failed without opening any log files.
Get-ChildItem "HKLM:\SOFTWARE\Microsoft\Windows\Autopilot\EnrollmentStatusTracking\ESPTrackingInfo\Diagnostics\Sidecar" -Recurse | ForEach-Object {
    Write-Host "--- KEY: $($_.Name) ---" -ForegroundColor Cyan
    $_ | Get-ItemProperty | Format-List
}
The registry path HKLM:\SOFTWARE\Microsoft\Windows\Autopilot\EnrollmentStatusTracking\ESPTrackingInfo\Diagnostics\Sidecar is documented in Microsoft’s official ESP troubleshooting guide. It is the same location that the Ctrl+Shift+D diagnostics page reads from if you look at the App Status entries, the CSP path ./Device/Vendor/MSFT/EnrollmentStatusTracking/Setup/Apps/Tracking/Sidecar/… maps directly to this registry key.
The PowerShell command simply enumerates every subkey under that path using Get-ChildItem -Recurse and reads the values with Get-ItemProperty, each subkey is a timestamped snapshot that ESP recorded during the deployment.
Source: Troubleshooting the Enrollment Status Page
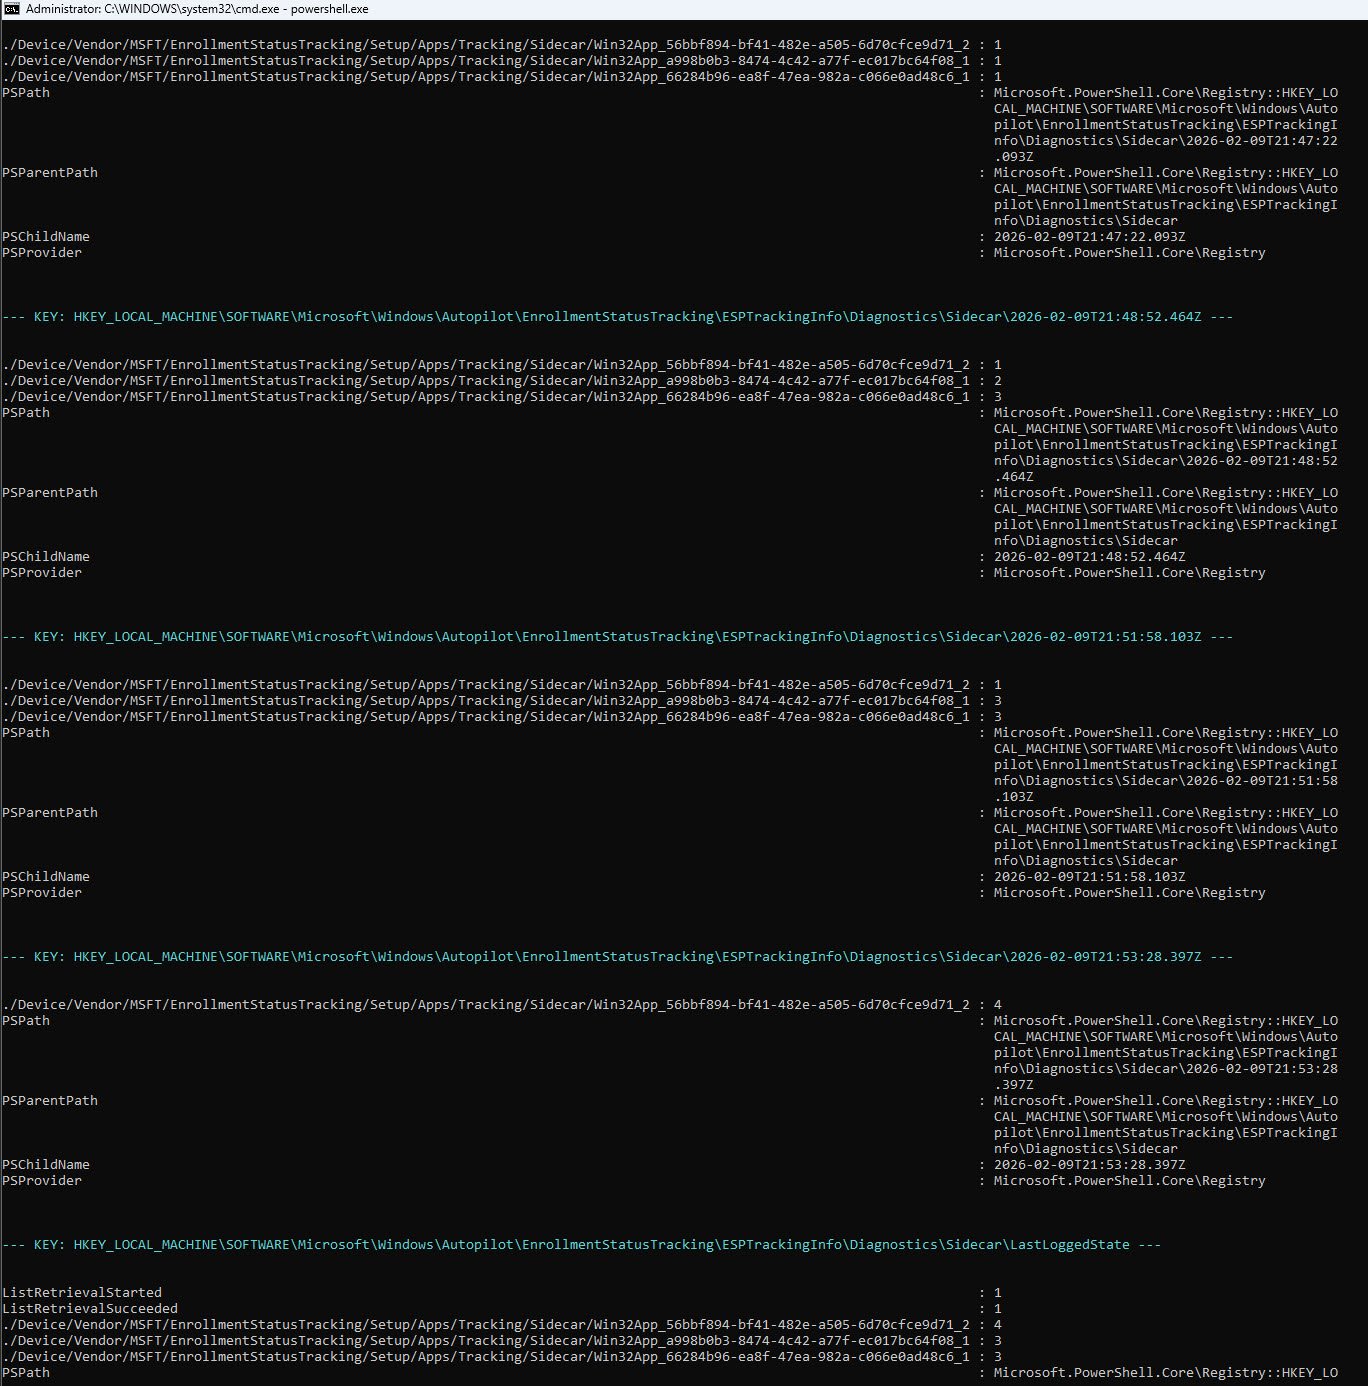
At 21:47:22Z all three apps were at state 1, ESP had just started processing them. By 21:48:52Z, app 66284b96 had already completed successfully while a998b0b3 was downloading. A minute later at 21:51:58Z a998b0b3 also finished but 56bbf894 never moved past state 1 during any of those snapshots, it sat at “In Progress” for over six minutes while the other two completed around it. At 21:53:28Z it jumped straight to state 4 (Failed), the LastLoggedState confirms that two apps succeeded and one failed.
Notice that in the last snapshot only 56bbf894 appears, the other two apps are no longer listed because they had already completed and ESP stopped tracking them. This is normal behavior once an app reaches state 3, ESP removes it from subsequent snapshots.
| Timestamp (UTC) | (56bbf894) | (a998b0b3) | (66284b96) |
|---|---|---|---|
| 21:47:22Z | 1 (In Progress) | 1 (In Progress) | 1 (In Progress) |
| 21:48:52Z | 1 (In Progress) | 2 (Downloading) | 3 (Success) |
| 21:51:58Z | 1 (In Progress) | 3 (Success) | 3 (Success) |
| 21:53:28Z | 4 (FAILED) | - | - |
| LastLoggedState | 4 (FAILED) | 3 (Success) | 3 (Success) |
💡Clue #2 App 56bbf894 stayed at state 1 (In Progress) for approximately six minutes while the other two apps completed successfully, then flipped directly to state 4 (Failed) at 21:53:28Z. The periodic snapshots confirm this is not a sudden crash, the app was stuck for an extended period before ESP finally recorded the failure. Combined with CLUE #1 (no finish time in the Ctrl+Shift+D output), the evidence now points to something going wrong during or immediately after the install attempt itself.
STEP 3: Verify the Autopilot Profile
Before opening any app-related logs, it is worth confirming that the Autopilot profile was delivered correctly. If the profile is missing, incomplete or assigned to the wrong tenant, nothing downstream will work regardless of how the apps are configured. The AutopilotDDSZTDFile.json file contains the profile that the device received during OOBE. If this file is empty or contains unexpected values, stop here ! The failure is in profile delivery, not app installation and the troubleshooting path changes entirely.
Finding the file (path varies by Windows version):
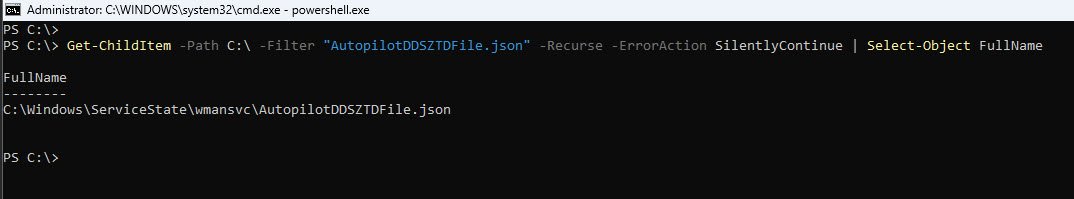
The Autopilot profile is stored in a file called AutopilotDDSZTDFile.json, the file path varies depending on the Windows version, on older builds it was located under C:\Windows\ServiceState\Autopilot, but on Windows 11 25H2 the path has changed to C:\Windows\ServiceState\wmansvc so rather than guessing, you can use this recursive search which will find it regardless of OS version:
Get-ChildItem -Path C:\ -Filter "AutopilotDDSZTDFile.json" -Recurse -ErrorAction SilentlyContinue | Select-Object FullName
Now that we know where the file is located, we read its contents and convert the raw JSON into a readable list:
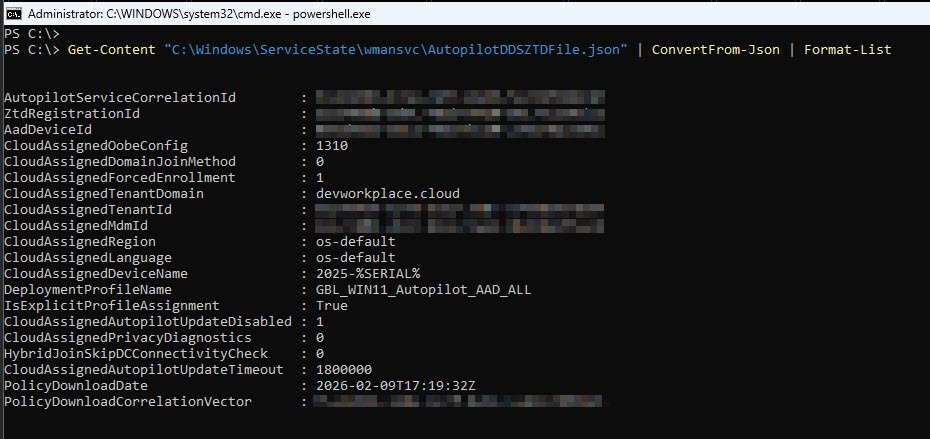
Get-Content "C:\Windows\ServiceState\wmansvc\AutopilotDDSZTDFile.json" | ConvertFrom-Json | Format-List
Get-Content reads the raw file, ConvertFrom-Json parses it into a PowerShell object and Format-List displays every property on its own line so nothing is truncated. The output contains every setting the Autopilot service delivered to this device during OOBE.
Note: I’ve obfuscated some of the info into the screenshots due to security concerns.
The five fields that matter most are:
| Field | Value | What it confirms |
|---|---|---|
| CloudAssignedTenantDomain | devworkplace.cloud | Device registered to the correct tenant |
| CloudAssignedDeviceName | 2025-%SERIAL% | Naming template is applied |
| DeploymentProfileName | GBL_WIN11_Autopilot_AAD_ALL | Correct deployment profile is assigned |
| CloudAssignedForcedEnrollment | 1 | MDM enrollment is mandatory, not optional |
| CloudAssignedDomainJoinMethod | 0 (Azure AD Join) | Cloud-native join, no hybrid complexity |
Autopilot profile is correct, tenant matches, naming template is applied, deployment profile is assigned, so the failure is NOT upstream it’s in the app installation layer.
STEP 4: Verify Tenant Registration
The Autopilot profile looked correct but the profile is only one piece of the puzzle. The device also maintains a separate registry key that records its tenant registration state, this is where Windows stores the outcome of the initial Autopilot service contact, independent of the profile JSON file. If the profile was delivered but the tenant registration failed or was disabled, the device could still behave unpredictably during enrollment.
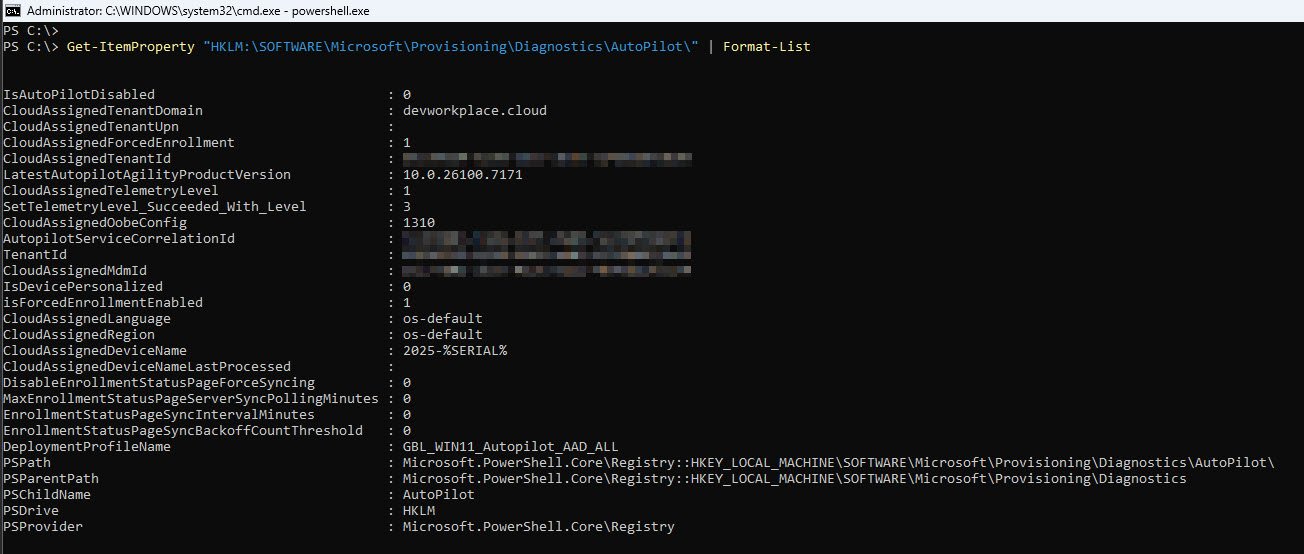
Get-ItemProperty "HKLM:\SOFTWARE\Microsoft\Provisioning\Diagnostics\AutoPilot" | Format-List
Get-ItemProperty reads all values from the specified registry key. This particular path is where Windows records the Autopilot provisioning diagnostics, it captures tenant assignment, enrollment enforcement and the Autopilot agent version that handled the deployment.
The four fields that confirm a healthy tenant registration:
| Field | Value | What it confirms |
|---|---|---|
| IsAutoPilotDisabled | 0 | Autopilot is active on this device, not disabled by policy or admin override |
| CloudAssignedTenantDomain | devworkplace.cloud | Matches the profile, device is talking to the correct tenant |
| isForcedEnrollmentEnabled | 1 | MDM enrollment cannot be skipped by the user during OOBE |
| LatestAutopilotAgilityProductVersion | 10.0.26100.7171 | Confirms the device is running Windows 11 25H2 with the current Autopilot agent |
STEP 5: Hunt the IME Log - Search for the App GUID
The Autopilot profile is correct and the tenant registration is clean so the failure might be somewhere in the app installation pipeline. The primary log for Win32 app processing is the IntuneManagementExtension.log, this is where the Intune Management Extension (Sidecar) records every action it takes: downloading content, executing install commands, running detection rules and reporting results back to the service.
The Sidecar registry from Step 3 gave us the GUID of the failed app, now we search the IME log for that App GUID to trace what happened from the moment Sidecar started processing it:
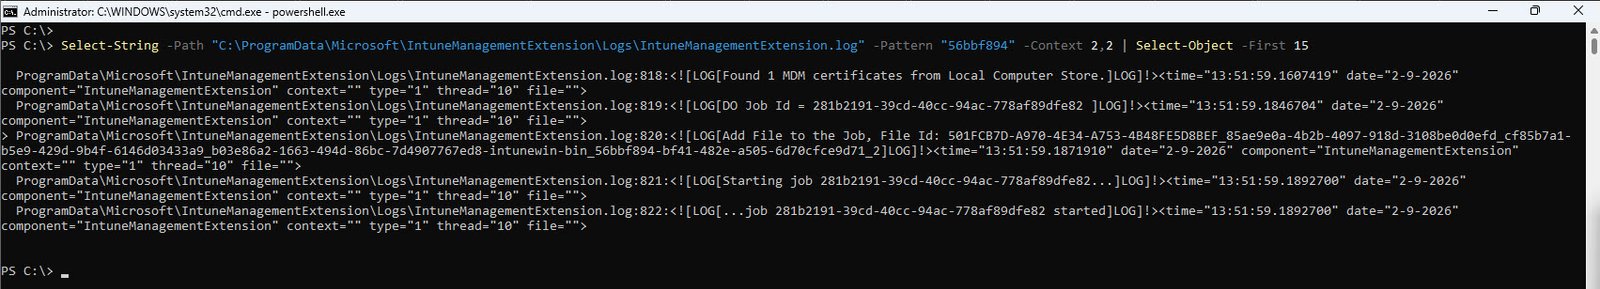
Select-String -Path "C:\ProgramData\Microsoft\IntuneManagementExtension\Logs\ IntuneManagementExtension.log" -Pattern "56bbf894" -Context 2,2 | Select-Object -First 15
Key finding Download phase only:
[13:51:59] DO Job Id = 281b2191-39cd-40cc-94ac-778af89dfe82 [13:51:59] Add File to the Job, File Id: …intunewin-bin_56bbf894-bf41-482e-a505-6d70cfce9d71_2 [13:51:59] Starting job 281b2191… [13:51:59] …job 281b2191 started [13:51:59] Waiting 43200000 ms for 1 jobs to complete
The Intune Management Extension created a Delivery Optimization job, added the .intunewin content package for our app to that job and started the download. The 43200000 ms timeout (12 hours) is the default maximum wait time for a DO job to complete, everything here looks normal the content was downloaded successfully.
But download is only half the story so what happened when the app was actually installed? Every Win32 app that reaches the MSI or EXE engine produces an exit code logged as lpExitCode. If the install ran, this value will be somewhere in the log:
Select-String -Path "C:\ProgramData\Microsoft\IntuneManagementExtension\Logs\ IntuneManagementExtension.log" -Pattern "lpExitCode" -Context 2,2
Annnd no results return…
💡Clue #3 There is no lpExitCode anywhere in the entire IME log so this is a important finding. The absence of an exit code means that msiexec was never called, the install command never reached the MSI engine and the content was downloaded successfully, but something failed between the download completing and the installer being invoked. The failure happened inside the PowerShell wrapper script before it could call the installer.
STEP 6: Check Available Log Files
The IME log showed us the download succeeded but the installer was never called so the missing lpExitCode tells us that the failure happened inside the PowerShell wrapper script, not inside msiexec. The IME log does not capture what happens inside a script’s internal execution, it only records that the script was launched and whether it returned a success or failure exit code. To find out what went wrong inside the script itself we need to check whether it left its own log.
Well-written Win32 app install scripts use Start-Transcript to record their own execution to a log file. If the script that wraps our failed app used this technique, there will be an additional log file in the IME logs directory that was not created by Intune itself.
A note for anyone packaging Win32 apps: always include Start-Transcript in your install scripts because when the IME log cannot tell you what went wrong, then the script’s own transcript becomes the most valuable piece of evidence in the entire investigation.
A simple directory listing reveals what logs are available:
Get-ChildItem "C:\ProgramData\Microsoft\IntuneManagementExtension\Logs\" | Select-Object Name, Length, LastWriteTime | Format-Table -AutoSize
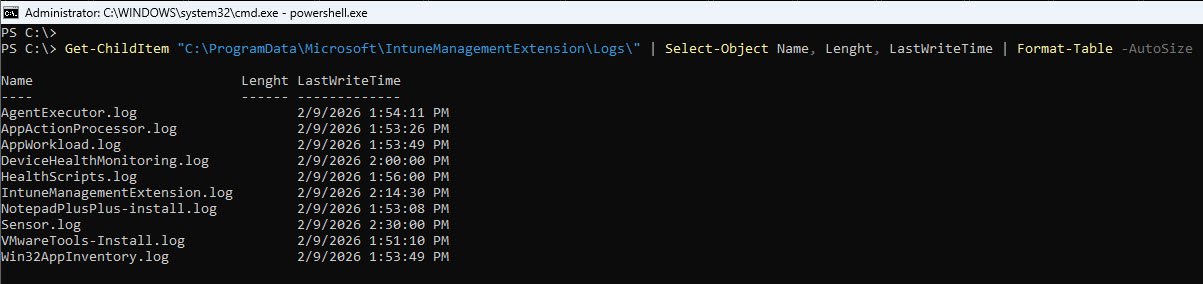
Key logs:
AgentExecutor.log 2/9/2026 1:54:11 PM AppWorkload.log 2/9/2026 1:53:49 PM IntuneManagementExtension.log 2/9/2026 2:14:30 PM NotepadPlusPlus-install.log 2/9/2026 1:53:08 PM
The NotepadPlusPlus log was written at 1:53 PM right in the window when the Sidecar registry showed our failed app transitioning from state 1 to state 4.
Now we have a name and the failed app is Notepad++ which left behind a transcript describing exactly what happened during its installation attempt.
💡Clue #4 NotepadPlusPlus-install.log exists in the IME logs directory, the install script used Start-Transcript to record its own execution. This is the direct eyewitness account of what happened inside the script, not filtered through the IME’s perspective, but the script’s own record of every command it ran and every error it encountered.
STEP 7: Read the Install Log - The Smoking Gun
The IME log told us the download succeeded, the missing lpExitCode told us the installer was never called, the directory listing revealed a custom transcript log left behind by the install script. Every clue has been pointing here so now its time to read what the script really recorded:
Get-Content "C:\ProgramData\Microsoft\IntuneManagementExtension\Logs\ NotepadPlusPlus-install.log"
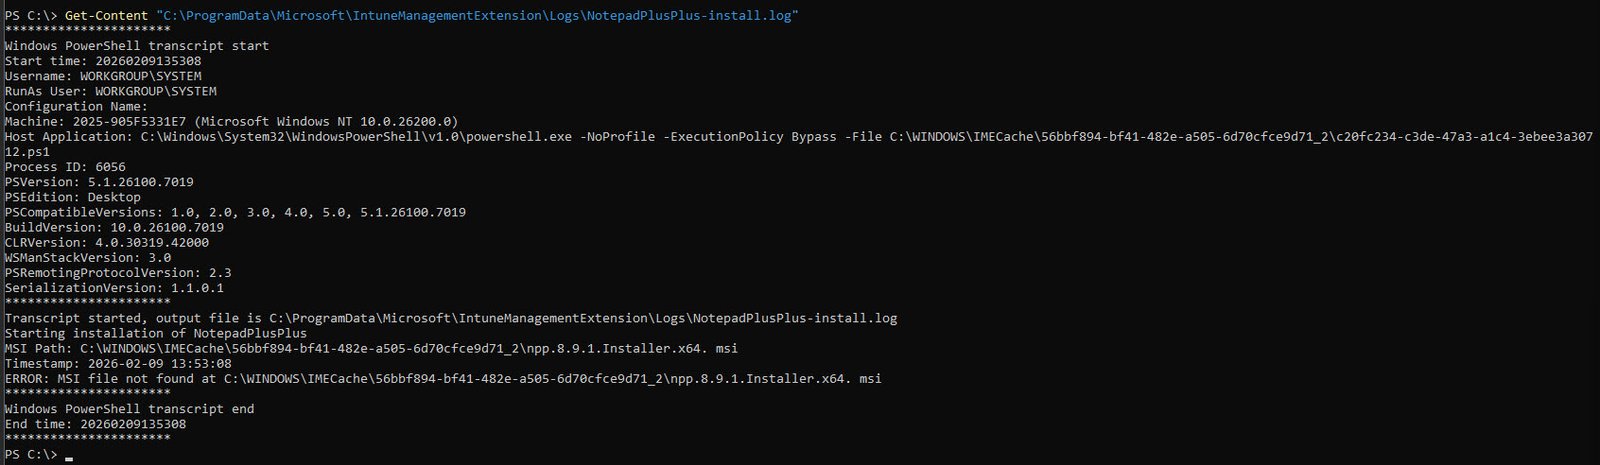
💡Smoking gun: If you look close enough, the MSI filename contains an extra space before the extension: npp.8.9.1.Installer.x64. msi when the actual file on disk is npp.8.9.1.Installer.x64.msi without space so the script looked for a file that does not exist, logged the error and exited. Start time and end time are identical: 20260209135308 therefore the entire script lived and died within the same second.
msiexec was never invoked because there was nothing to invoke it with, the file path pointed to a filename that did not exist on disk.
Root cause: A single extra space in the $MsiFile variable inside the PS script Install-NotepadPlusPlus.ps1.
STEP 8: Cross-Validate with AppWorkload.log
The AppWorkload.log provides the IME state machine’s perspective. This is the newer, more structured companion to the IME log, both Rudy Ooms and Steve Weiner reference it as a key troubleshooting resource in their many articles/YouTube videos.
Select-String -Path "C:\ProgramData\Microsoft\IntuneManagementExtension\Logs\AppWorkload.log" -Pattern "56bbf894" -Context 0,1 | Select-Object -Last 10
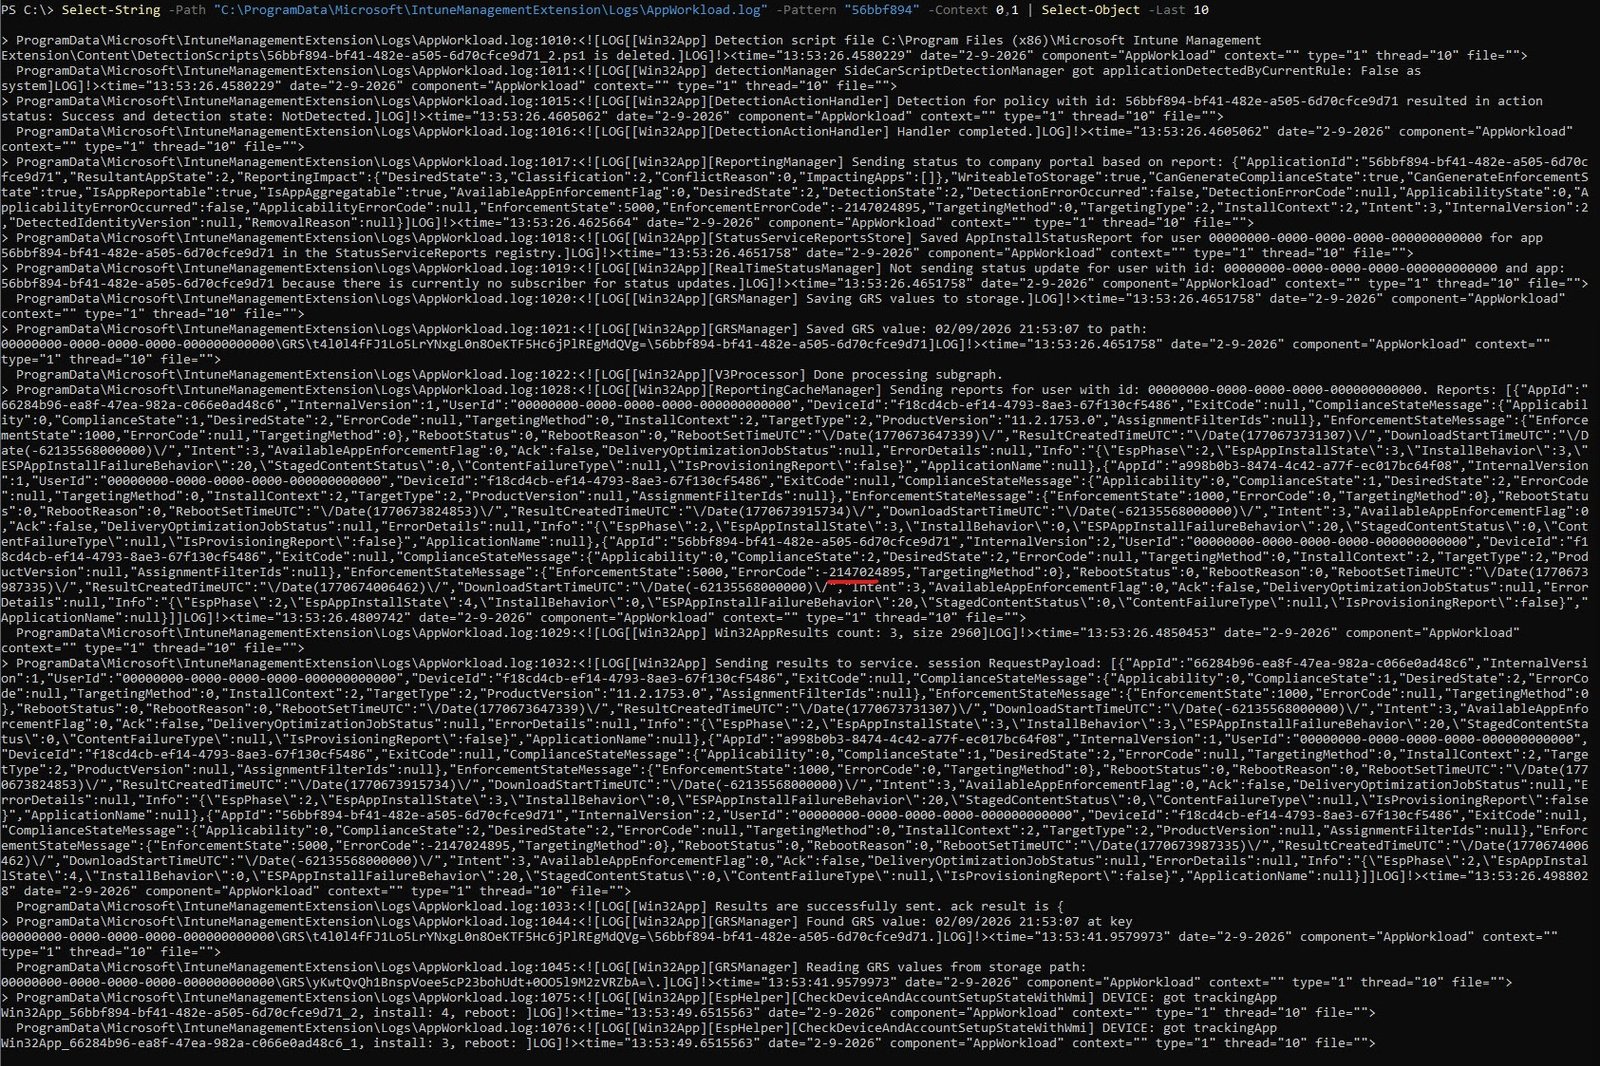
Key findings:
| App | EnforcementState | ErrorCode | EspInstallState |
|---|---|---|---|
| VMware Tools (66284b96) | 1000 (Success) | null | 3 (Success) |
| Company Portal (a998b0b3) | 1000 (Success) | 0 | 3 (Success) |
| Notepad++ (56bbf894) | 5000 (Error) | -2147024895 | 4 (Failed) |
Error code -2147024895 converts to hex: 0x80070001 (ERROR_INVALID_FUNCTION) matching exactly what the ESP screen displayed. Detection ran after the install “completed” and returned NotDetected because Notepad++ was never actually installed:
[Win32App] [DetectionActionHandler] Detection for policy 56bbf894…resulted in detection state: NotDetected
STEP 9: Cross-Validate with Event Viewer
The install log gave us the root cause and AppWorkload.log confirmed the error codes, but those are both components of the Intune Management Extension they are part of the same system. A proper investigation cross-validates findings against independent sources, Event Viewer is a completely separate logging subsystem that records operating system-level events, so if the Autopilot and Windows Installer events tell the same story, we can be confident the conclusion is solid.
During OOBE there is no Start menu and no taskbar so you cannot launch Event Viewer the usual way, instead from the PowerShell prompt type mmc to open the Microsoft Management Console. Once the empty console opens go to File -> Add/Remove Snap-in, select Event Viewer (Local) from the available snap-ins list, click Add and then OK. This gives you full access to all event logs on the device.
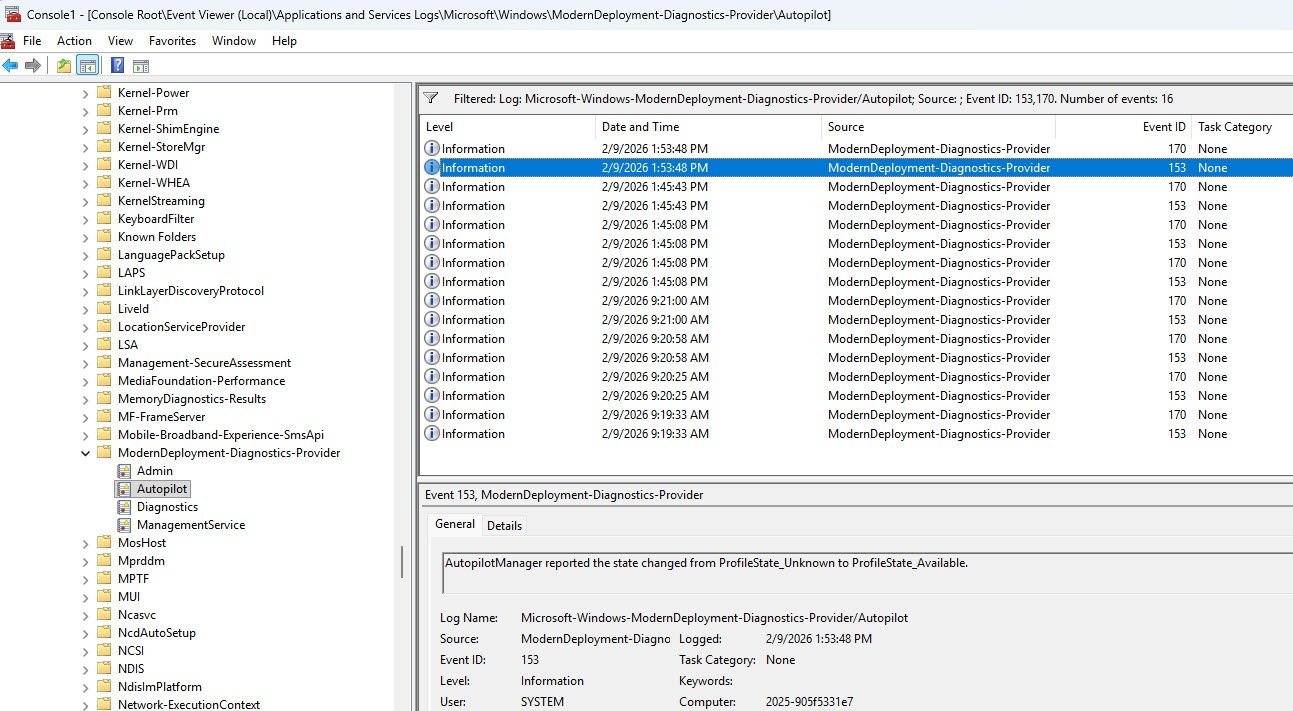
Navigate to Applications and Services Logs -> Microsoft -> Windows -> ModernDeployment-Diagnostics-Provider -> Autopilot because this is where Windows records Autopilot specific provisioning events. The log will contain a mix of informational events and the volume can be noisy so rather than scrolling through everything, right-click the log and select Filter Current Log and manually enter 153,170 in the Event IDs field, these are the two events that confirm whether the Autopilot profile was successfully downloaded and activated.
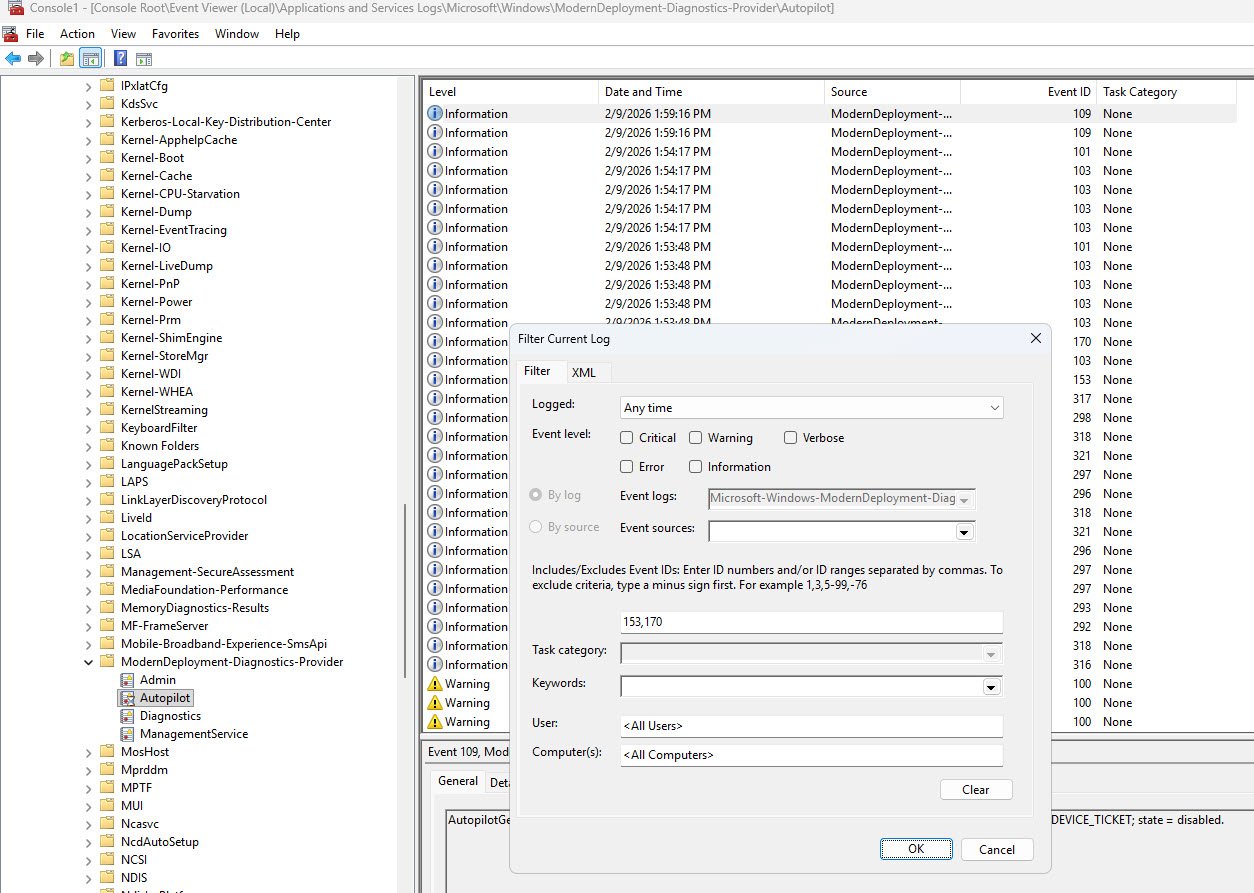
Event 170 is logged when the Autopilot profile has been successfully downloaded from the Intune service, its presence confirms that the device reached the cloud, authenticated and retrieved its deployment profile without issues.
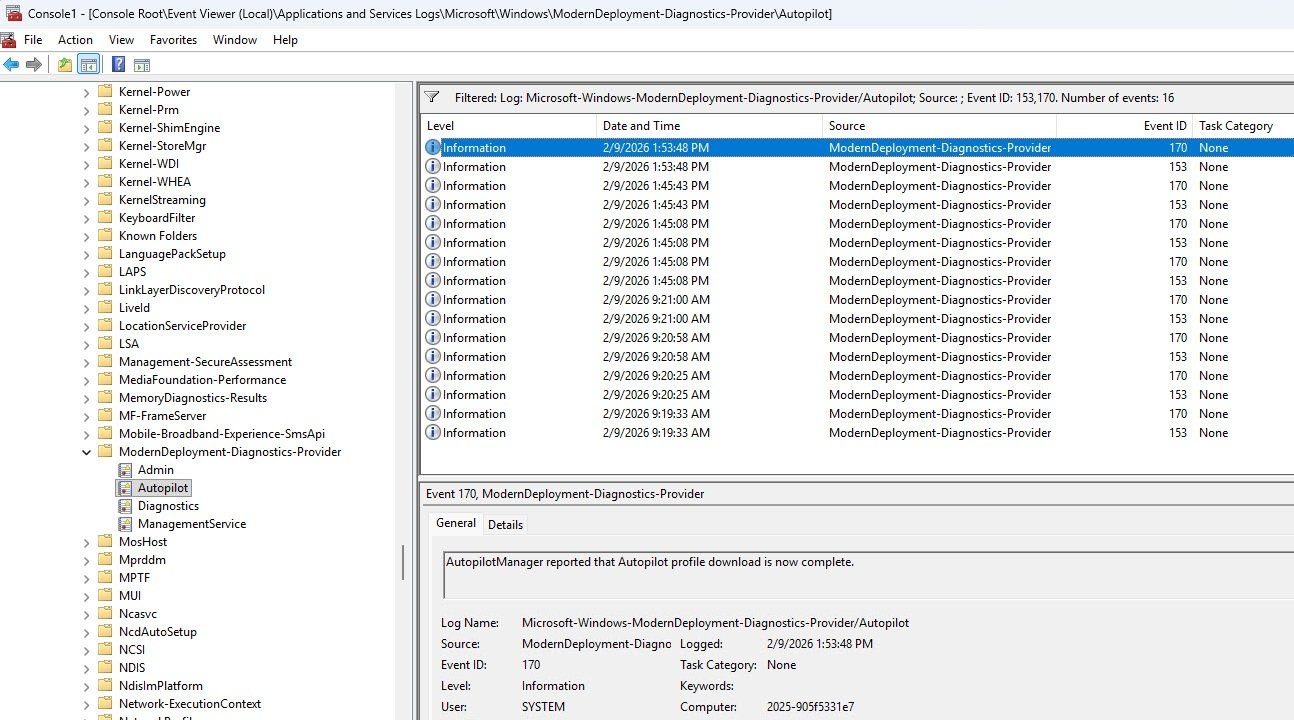
Event 153 records the state transition to ProfileState_Available meaning the downloaded profile was parsed and activated, the device knows its deployment configuration (tenant, join type, ESP settings) and is ready to proceed with provisioning.
What matters just as much as what is present is what is absent: Event 303 which Windows logs when Autopilot provisioning completes successfully, is nowhere in the log hence its absence confirms that provisioning started but never finished, consistent with everything we have found so far.
Note: If you also verify the Event Viewer - Applications and Services Logs - Microsoft - Windows - ModernDeployment-Diagnostics-Provider - Admin and find it empty means that Enterprise Diagnostics log rules out MDM enrollment issues, policy conflicts and CSP failures hence the problem is isolated to the Win32 app installation pipeline.
| Event ID | Message | Status |
|---|---|---|
| 170 | Autopilot profile download complete | Profile downloaded OK |
| 153 | State changed to ProfileState_Available | Profile activated |
| 303 | (NOT PRESENT) | Provisioning never completed |
💡Clue #5 Missing Event 303 confirms provisioning never completed. Missing MsiInstaller entry for Notepad++ confirms msiexec was never invoked so this cross-validates the install log finding from a completely independent source.
The Red Herrings
While examining the Event Viewer during a failed enrollment, you will almost certainly encounter events that look alarming but have nothing to do with the actual failure. These also are worth addressing because they cause unnecessary panic, especially for engineers who are troubleshooting Autopilot for the first time and are already under pressure to find a root cause.
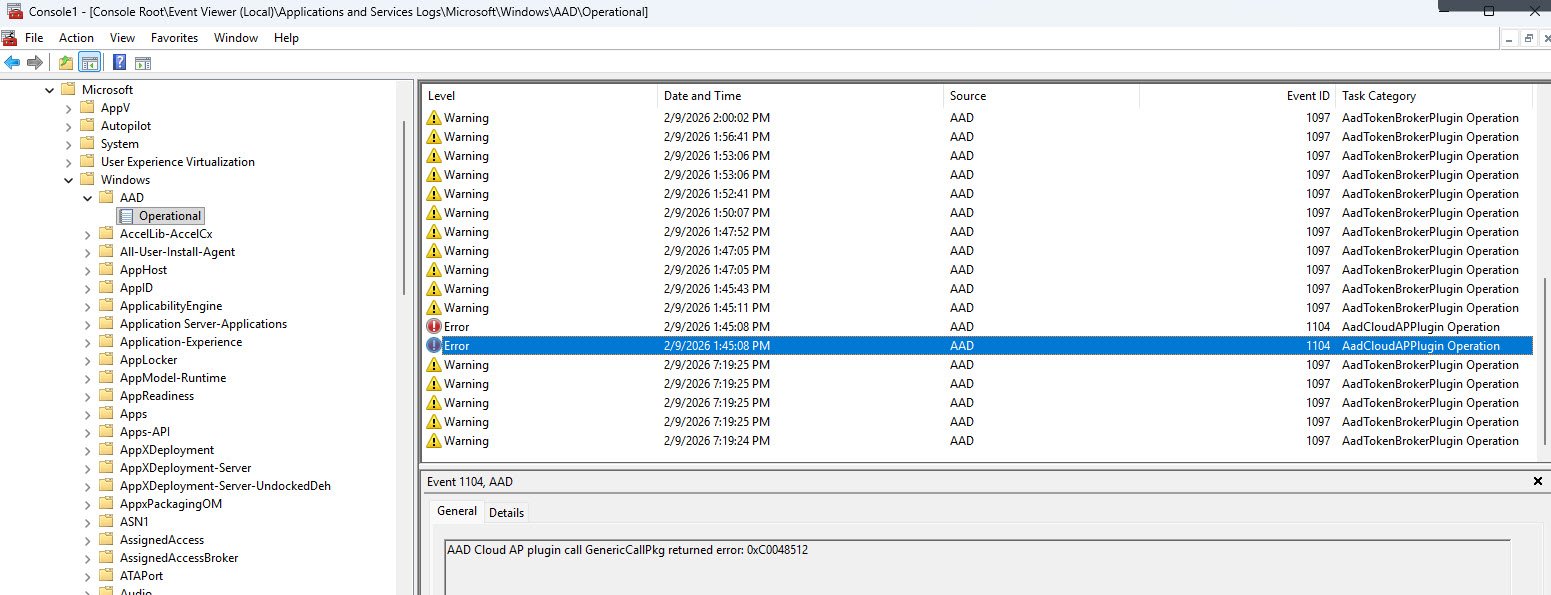
In Applications and Services Logs -> Microsoft -> Windows -> AAD -> Operational, two event types stand out immediately because they are flagged as warnings and errors:
Event 1104 appears as an error with status code 0xC0048512 which reference a Cloud AP plugin authentication negotiation failure. At first glance this looks serious, an authentication error during enrollment which sounds like it could block the entire process but this is expected behavior during OOBE bootstrapping. The Cloud AP plugin goes through multiple negotiation rounds as the device establishes its identity with Entra ID and some of those early rounds fail before the final handshake succeeds.
These events are present on every Autopilot deployment including ones that complete without any issues and are not related to app installation failures.
Event 1097 is even more deceptive because it appears as a warning and the message body contains the word “Error:” which is exactly what your eyes will lock onto when you are scanning logs looking for a root cause, but if you read the full message instead of stopping at the first occurrence, you’ll find that every single one of these entries ends with “successfully” or “complete.”
These are AAD plugin migration tasks that completed fine so the misleading log text is a formatting issue in the event message itself and not an indication of failure.
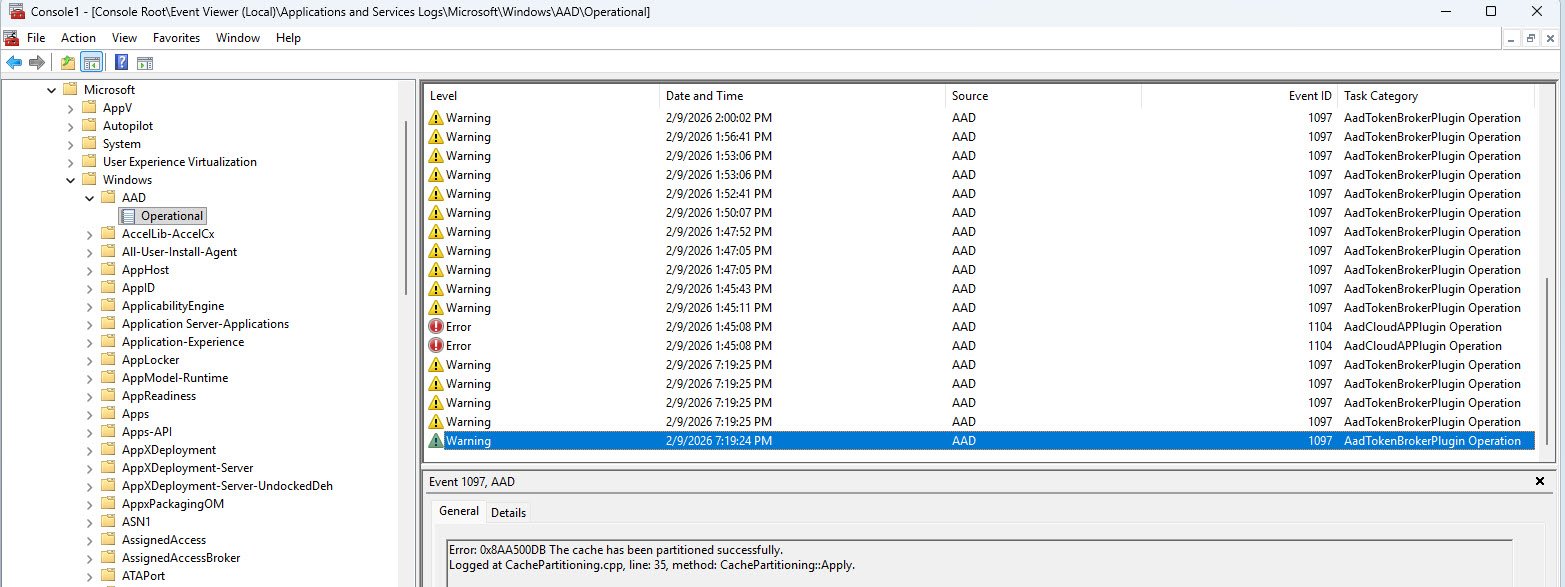
Pro tip: When scanning Event Viewer during Autopilot troubleshooting do not react to the event level (Warning, Error) or to keywords in isolation, instead always read the complete message text. Event 1097 in particular has tripped up countless engineers because the word “Error” appears in a message that actually reports success.
If you remember nothing else from this section, remember this: the AAD Operational log is full of noise during OOBE, therefore try to focus your attention on the ModernDeployment-Diagnostics-Provider -> Autopilot log and the application log (for MsiInstaller events) those are where the signal is.
STEP 10: Collect MDM Diagnostics CAB for Offline Analysis
Every piece of evidence so far has been gathered live on the device while it sits at the failed ESP screen. That works when you have direct access to the machine but in production you may need to escalate the diagnostics to a colleague, revisit them days later or analyze them on a different workstation entirely. The MDMDiagnosticsTool packages everything into a single CAB file that can be extracted and examined offline.
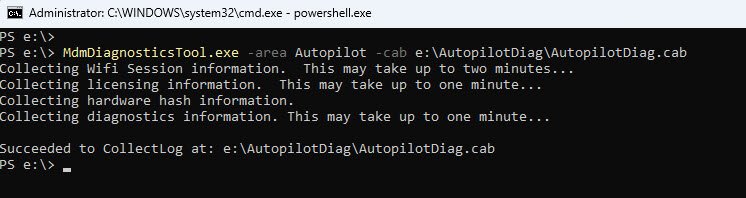
From the PowerShell prompt run the following command:
Note that this is a native Windows executable not a PowerShell cmdlet, so no module installation is required:
MdmDiagnosticsTool.exe -area Autopilot -cab E:\AutopilotDiag\AutopilotDiag.cab
On Windows 11 v25H2, the Tpm diagnostic area should be added too using -area Autopilot;Tpm, however since I’ve did all my testing on a VMware Workstation Pro VM, adding the Tpm area caused the collection to fail even though the VM has a functional vTPM that Windows recognizes for BitLocker and Autopilot enrollment.
The likely reason is that the Tpm area triggers deeper TPM hardware interrogation (attestation keys, EK certificates) that VMware’s software-emulated vTPM does not fully support. Michael Niehaus notes that the Tpm area can generate error messages or popups and recommends it only for self-deploying or pre-provisioning (white glove) scenarios where TPM attestation is actually required.
For user-driven Autopilot troubleshooting (my scenario) the Autopilot area alone is sufficient. Also worth noting that Microsoft’s older documentation references the area as TPM (all caps), while the tool’s own help text on newer builds shows Tpm (Pascal case). The area names are stored as registry keys under HKLM\SOFTWARE\Microsoft\MdmDiagnostics\Area, so check what your build actually has if you run into issues.
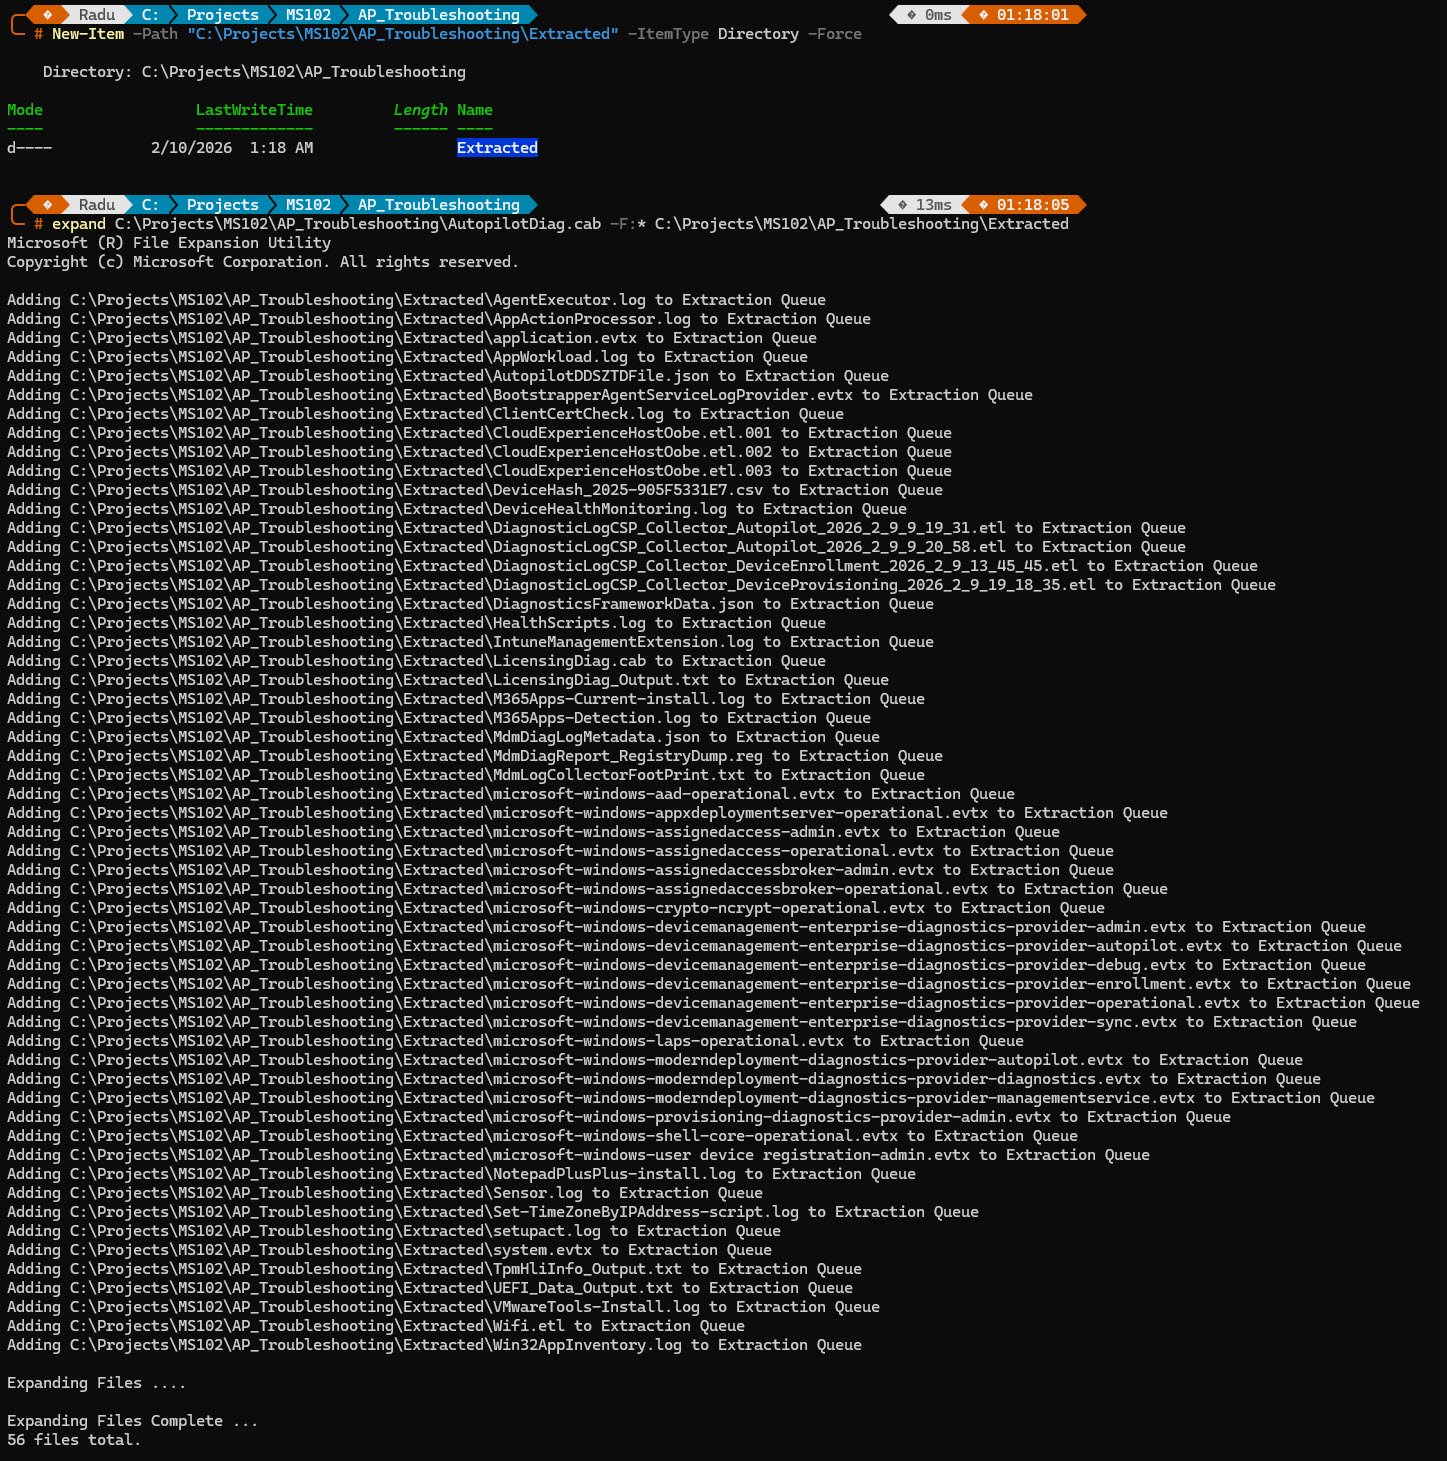
Once the CAB file is on the USB drive (in my case it’s E:), extract it on your workstation using expand or any archive tool. On Windows 11 25H2 the extracted contents are significantly more comprehensive than what older builds produce:
expand E:\AutopilotDiag\AutopilotDiag.cab -F:* E:\AutopilotDiag\Extracted
The extraction produces 56 files on this 25H2 build, Key files include the IntuneManagementExtension.log, AppWorkload.log and AgentExecutor.log (the same IME logs we queried live), Event Viewer exports as .evtx files, the AutopilotDDSZTDFile.json profile, custom install transcript logs like NotepadPlusPlus-install.log, the DeviceHash CSV containing the hardware hash and most importantly MdmDiagReport_RegistryDump.reg a registry export that contains everything we checked manually and more.
STEP 11: Offline Analysis - Registry Dump from CAB
Every registry key we’ve queried live on the VM during this investigation is in this file, along with hundreds of additional keys we never looked at. This is the offline equivalent of all our registry queries combined into a single searchable text file.
The advantage of working with the registry dump is that you do not need access to the failed device anymore, the CAB can be extracted on any workstation, shared with a colleague or archived for later review. For organizations where the engineer troubleshooting the failure is not the same person who has physical access to the device, this is often the only way to perform deep analysis.
To search the registry dump for our failed app, use Select-String with the App GUID we’ve identified back in Step 1:
Select-String -Path "...\Extracted\MdmDiagReport_RegistryDump.reg" -Pattern "56bbf894" -Context 2,5 | Select-Object -First 10
Select-String is PowerShell’s equivalent of grep, it searches a text file for lines matching a pattern and returns the matches with surrounding context, in this case the -Pattern “56bbf894” targets our failed app’s GUID.
The -Context 2,5 parameter returns 2 lines before and 5 lines after each match, which is enough to capture the registry key path above and the associated values below.
Select-Object -First 10 limits the output to the first 10 matches to keep the console readable the GUID appears in many locations across the dump and showing all of them would flood the screen.
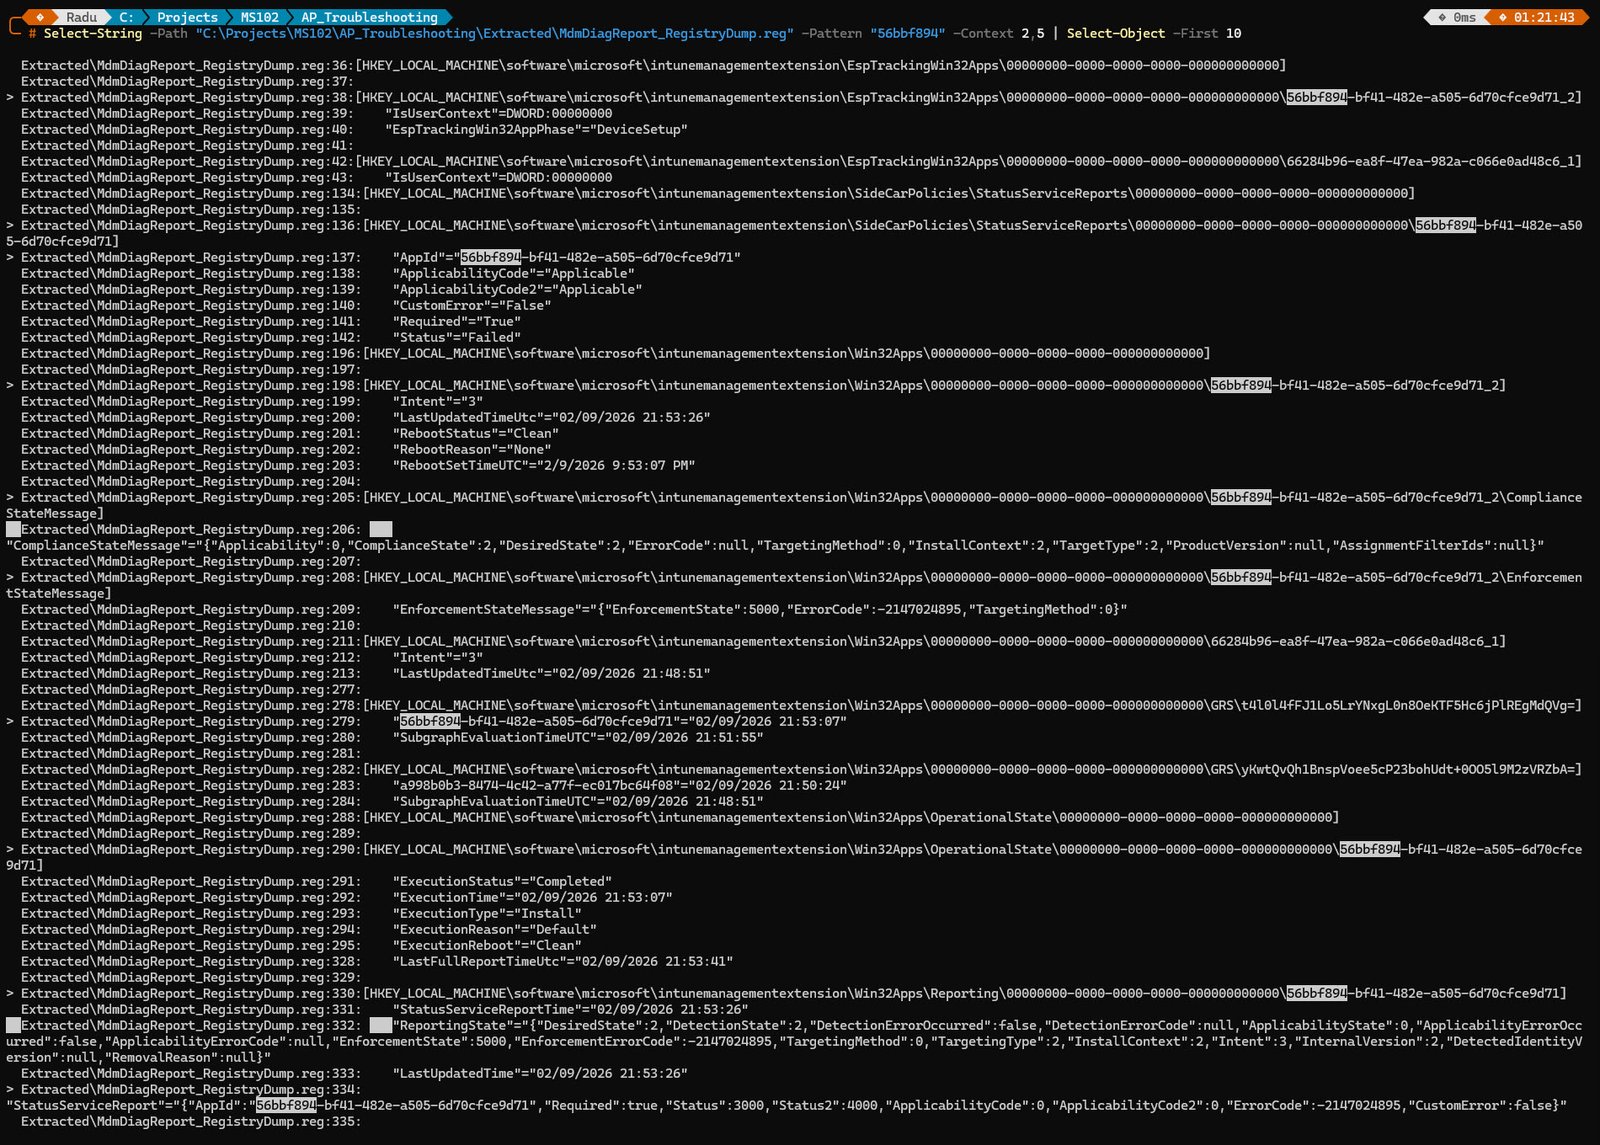
Six independent registry locations all tell the same story:
| Registry Location | Key Field | Value |
|---|---|---|
| EspTrackingWin32Apps | EspTrackingPhase | DeviceSetup |
| StatusServiceReports | Status | Failed |
| EnforcementStateMessage | EnforcementState | 5000 (Error) |
| EnforcementStateMessage | ErrorCode | -2147024895 (0x80070001) |
| ComplianceStateMessage | DetectionState | 2 (NotDetected) |
| OperationalState | ExecutionStatus | Completed |
| Reporting | Status / Status2 | 3000 / 4000 (Failed) |
Each of these registry locations serves a different purpose in the Intune management pipeline, yet every single one records the same outcome for GUID 56bbf894:
EspTrackingWin32Apps confirms the failure occurred during the Device Setup phase. StatusServiceReports records the app’s final status as Failed. EnforcementStateMessage captures both the enforcement error code (5000) and the underlying Windows error (-2147024895, which converts to 0x80070001 the same code the ESP screen displayed at the very beginning of this investigation). ComplianceStateMessage shows the detection state as NotDetected because the app was never installed, detection had nothing to find. OperationalState records ExecutionStatus as Completed, which is technically correct the IME completed its attempt to install the app, even though that attempt failed. Reporting captures the status codes that Intune uses to report the failure back to the service.
Final notes
Eleven steps, Nine evidence sources, One space.
The methodology matters more than the specific failure so the next time ESP fails in your environment it probably won’t be a typo in an MSI path but the approach will be the same: start at the screen, work through the evidence sources one at a time, cross-validate and don’t stop at the first answer that looks right.
I hope this walkthrough saves someone a few hours of staring at logs wondering where to start.